
August at a Glance: Sales, Inventory & SAR
August was… quiet.
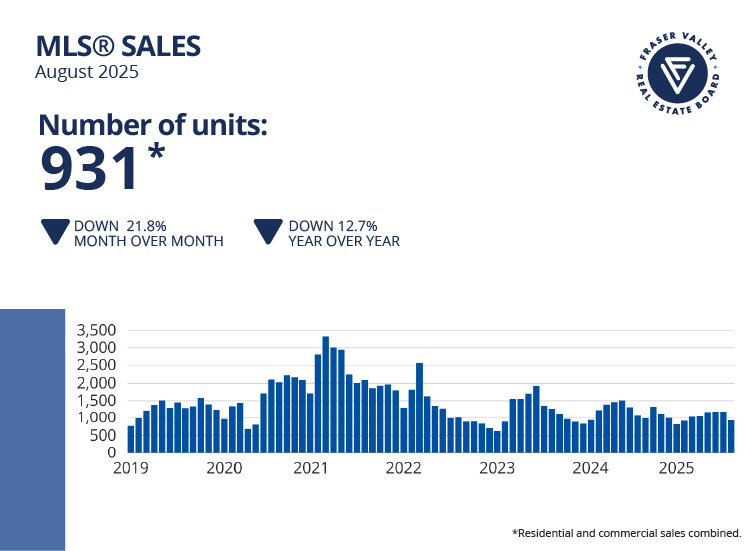
Sales dropped more than 20% from July, landing at just 931 transactions, 13% below last August and 36% below the 10-year average.
Despite the slowdown, inventory held relatively stable at just over 10,400 active listings. And while that’s down 2% from July, it still puts us deep in buyer’s market territory.
The sales-to-active listings ratio sits at just 9%. As a reminder, the Fraser Valley Real Estate Board considers a balanced market to be between 12% and 20%. This means more inventory, more negotiation leverage for buyers, and softer price trends as we head into fall.
Prices by Property Type (Detached, Townhomes, Condos)
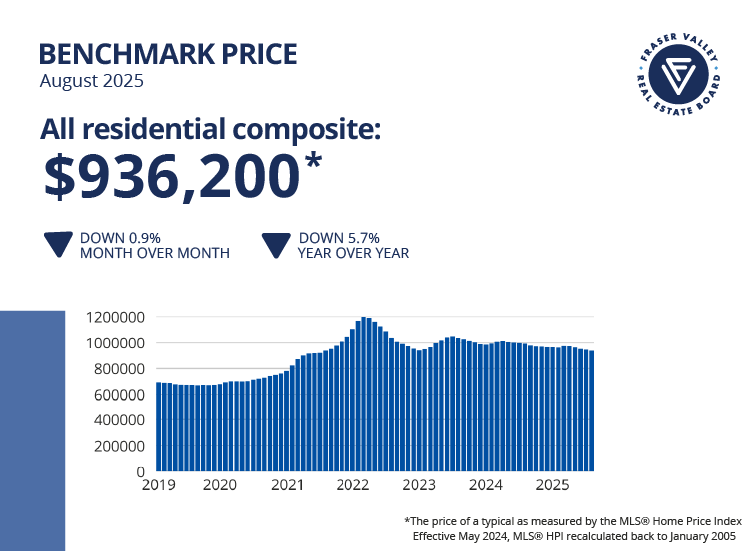
● The composite Benchmark Price dropped 0.9% month-over-month to $936,200.
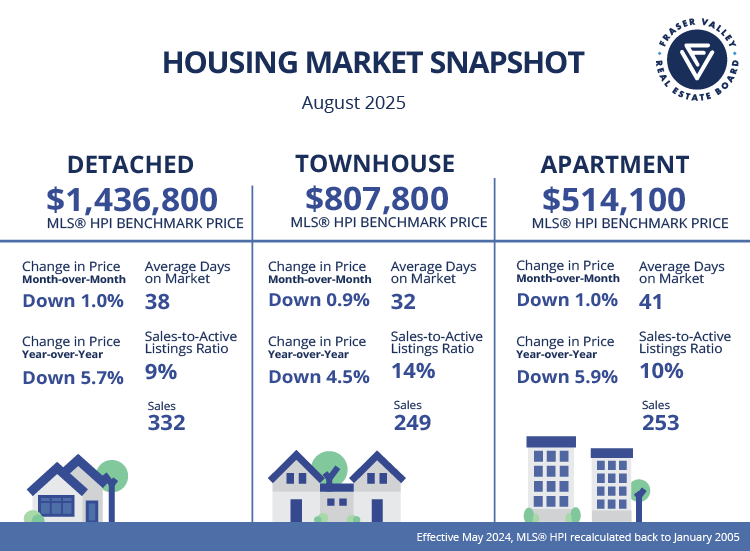
● Detached homes fell to $1,436,800, down 1% from July and down 5.7% year-over-year.
● Townhomes dropped to $807,800, down 0.9% month-over-month and 4.5% annually.
● Condos declined to $514,100, off 1% from July and 5.9% from last year.
So far, the price declines have been orderly, but it’s clear that the Spring bump wasn’t enough to carry momentum through summer.
Days on Market: Average vs. Median
The average days on market in August stretched out again:
● Condos: 41 days (up from 38 in July)
● Detached: 38 days (no change from July)
● Townhomes: 32 days (down slightly from 35 in July)
But when you look at median days to sell, it paints a slightly different picture:
● Detached: 27 days up from 21
● Townhomes: 23 days up from 20
● Condos: 26 days up from 23
That means while slowing, some properties are still moving quickly, likely the ones priced well or offering standout value, but many others are sitting much longer.
Listings & Relists: What to Expect in September
Across the board, failed listings dropped compared to July, but that’s seasonal. Most sellers hold off in August to reposition in September. Expect a wave of re-lists this month, which could add even more pressure to already elevated inventory levels.
Rates & Macro: BoC, Bond Yields, Confidence
The next BOC rate announcement is scheduled for September 17th, and with news of significant job losses over summer, the BOC is being pressured to cut rates. Even with whispers of rate cuts, buyers remain hesitant.
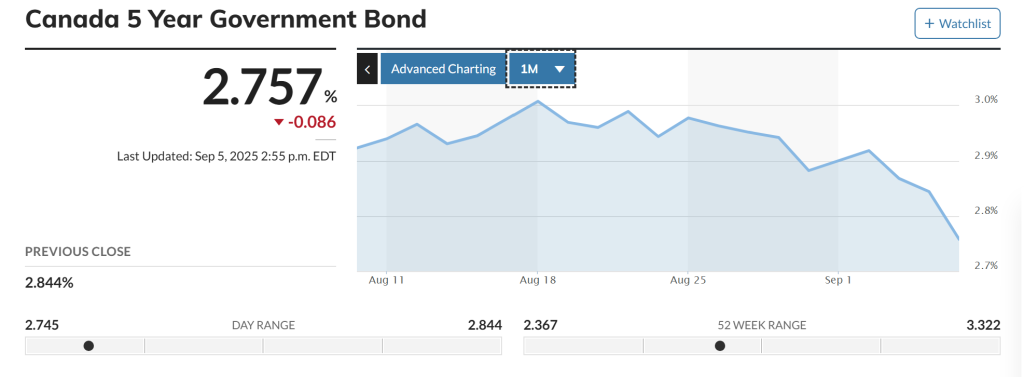
On a positive note, at least for mortgage holders, 5 year bond yields have finally started trending down, and are currently sitting at roughly 2.75% at time of writing/recording. With any luck we’ll see a break on fixed rates as a result.
Regardless, consumer confidence remains shaky, job losses, political uncertainty, and inflation are all still very real concerns. Delinquencies remain low but are ticking up slightly, a trend worth watching even if it’s not a red flag yet.
Anecdotally, showings were light across the board in August. I had one quick sale, accepted offer inside 7 days, but I’ve also had listings with little to no activity. Some condo segments still see competition, but they’re the exception. Overall, the market feels sluggish.
September has historically brought a bump in activity as people return from summer vacations, but this year I wouldn’t expect more than a nominal increase. The broader economic outlook seems to be overpowering seasonal trends.
What This Means for Buyers & Sellers (CTA)
So where does that leave us?
Locally, we’re facing high inventory, soft sales, and falling prices. Nationally, growth is stagnant and consumer confidence is low. Buyers are waiting for better deals, and sellers are hesitant to drop prices, which means the standoff continues.
If you’re buying, you’ve got leverage.
If you’re selling, pricing aggressively and strategically is key.
And hey, be thankful you don’t live in Ontario. Their prices have cratered even more sharply in several key markets.
As always, if you want to dig deeper into your neighbourhood or property type, check out my Market Area data or reach out directly. Whether you’re thinking of making a move now or just want to plan for the future, I’m always happy to help.


