
Tariffs, economic uncertainty stall spring market in the Fraser Valley
March home sales in the Fraser Valley came in nearly 50% below the 10-year average, marking the slowest start to a spring market in more than 15 years.
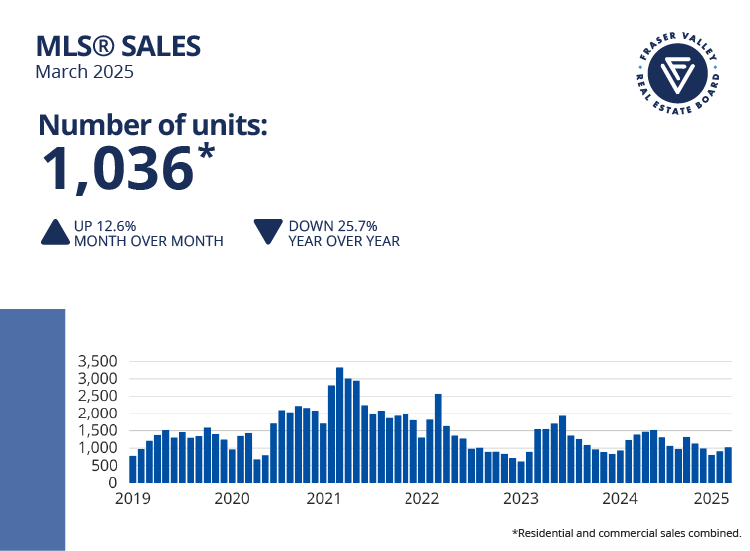
The Fraser Valley Real Estate Board recorded 1,036 sales in March, up 13% from February, but still 26% below sales recorded this time last year.
Following a decline on the Board’s Multiple Listing Service® (MLS®) in February, new listings increased 22% in March to 3,800. Overall inventory is at a decade-high level, with 9,219 active listings, 49% above March 2024 and 59% above the 10-year seasonal average.
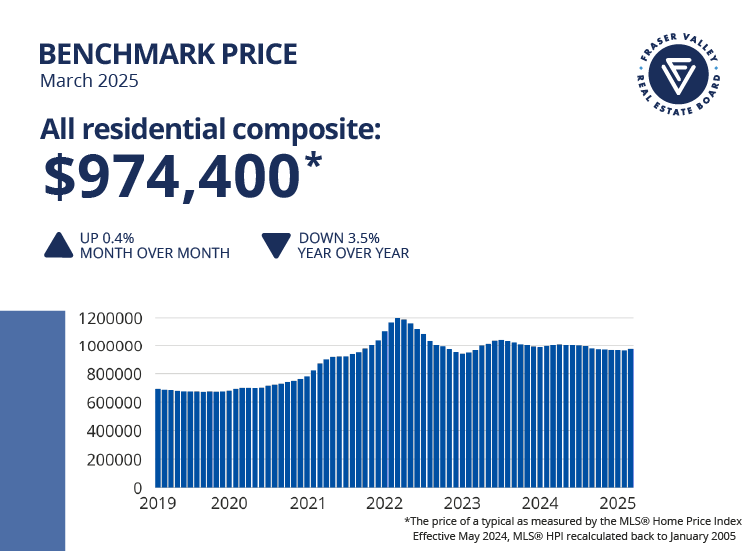
The composite Benchmark price in the Fraser Valley edged up just under half a percent in March, up 0.4% to $974,400.
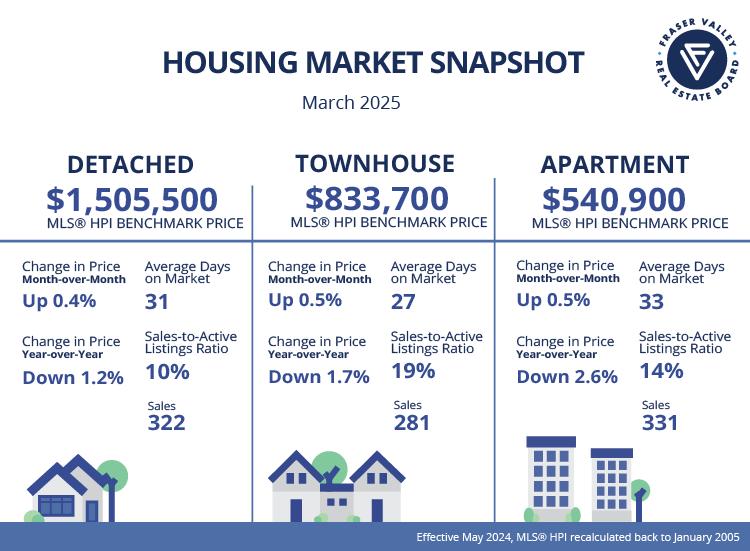
MLS® HPI Benchmark Price Activity
- Single Family Detached rose to $1,505,500, increasing 0.4% compared to February and down 1.2% compared to March 2024. Average days to sell was 31 days, 8 days faster than the previous month
- Townhomes rose to $833,700, increasing 0.5% compared to February and decreasing 1.7% compared to March 2024. They took an average of 27 days to sell, 5 days faster than last month
- Apartments: also rose 0.5% to $540,900, up 0.5% compared to February, but down 2.6% compared to March 2024. They were the slowest to sell in March, at 33 days on average, 4 days faster than the previous month
The overall sales-to-active listings ratio continues to signal a buyer’s market in the Fraser Valley, with a ratio of 11%. The market is considered to be balanced by the board when the ratio is between 12% and 20%.
As always, bear in mind that this is an average of all property types, across all areas in the valley. If you dig deeper into specific neighbourhoods and housing types you get a very different picture depending on where you look.
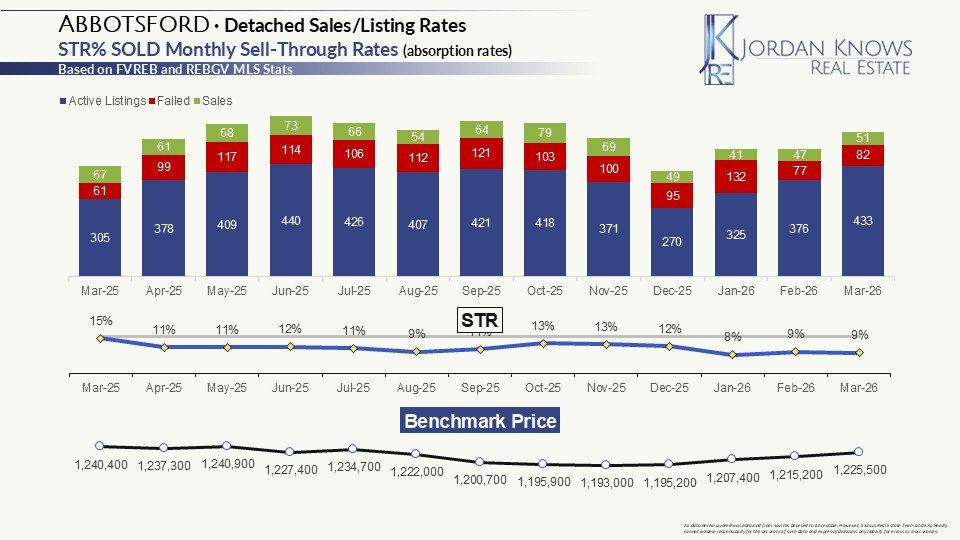
Abbotsford detached homes are deep in buyer’s market territory, with a sell through rate of 8%, while someone shopping in North Vancouver would find a very different detached market, as their sell through is over 17%.
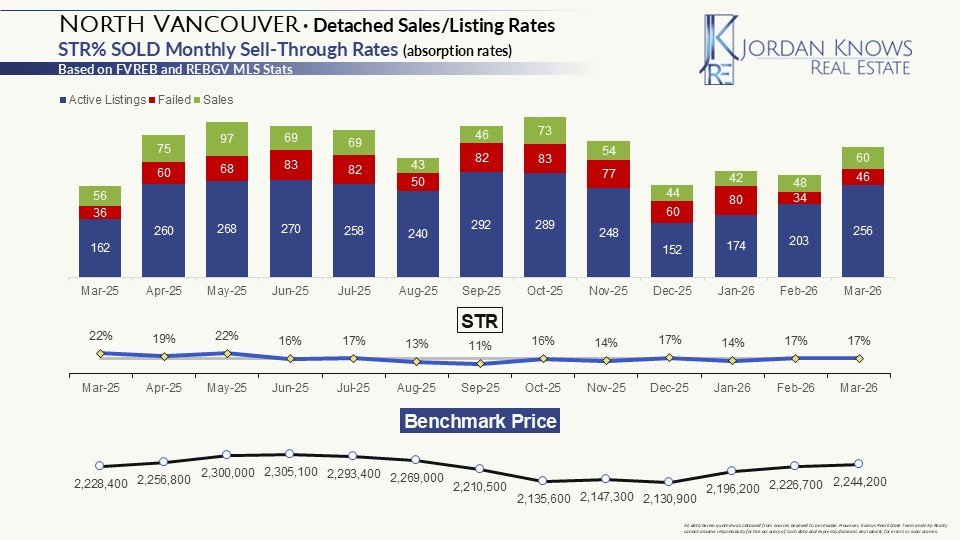
Even within the same cities, there can be a big difference in market dynamics by property type.
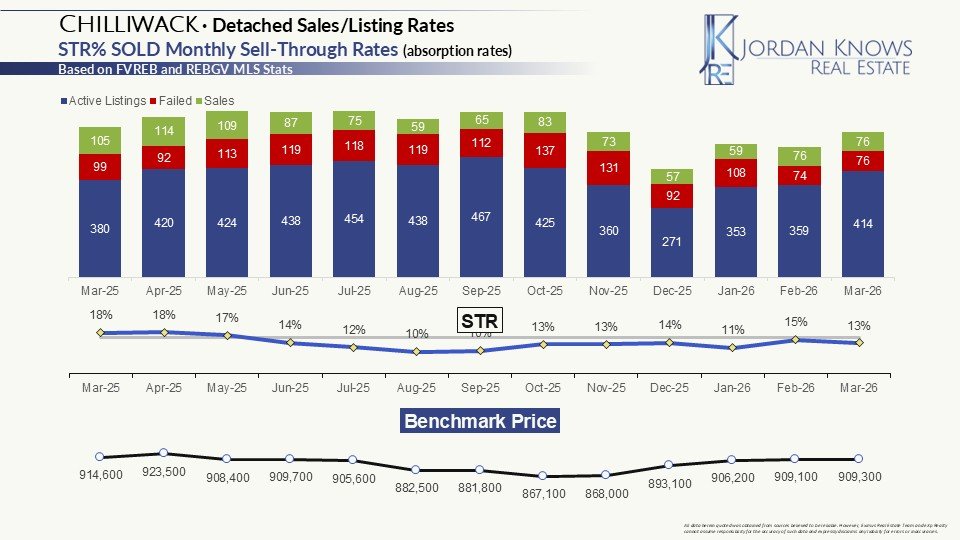
Chilliwack detached are at a fairly balanced sell through of 13%, while Slide 8 townhomes are moving at a brisk 27%, deep into a seller’s market.
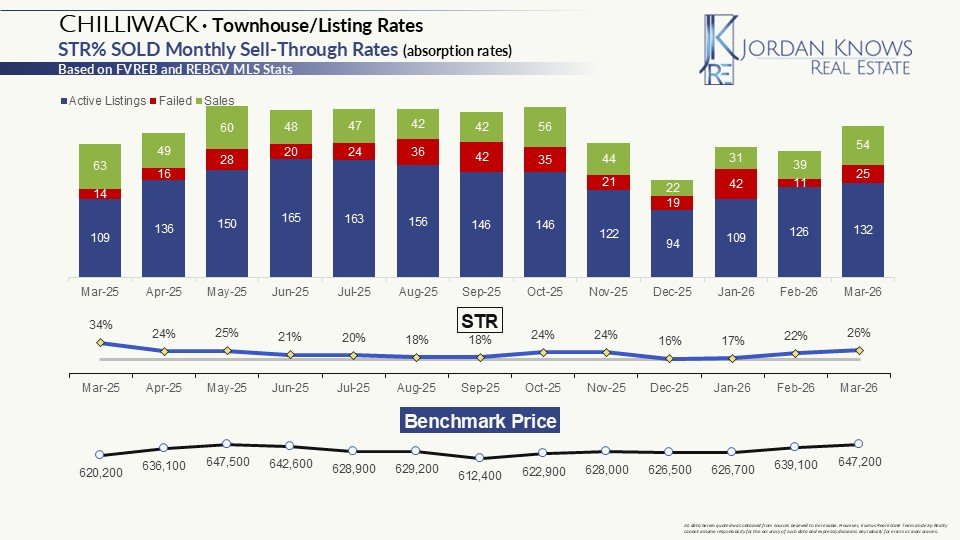
This would have a large impact on homeowners looking to move up or down the property ladder. For example, someone moving from townhomes into a detached has more buying power, options, and negotiating ability. Further they’d have peace of mind knowing they are selling in a much stronger market.
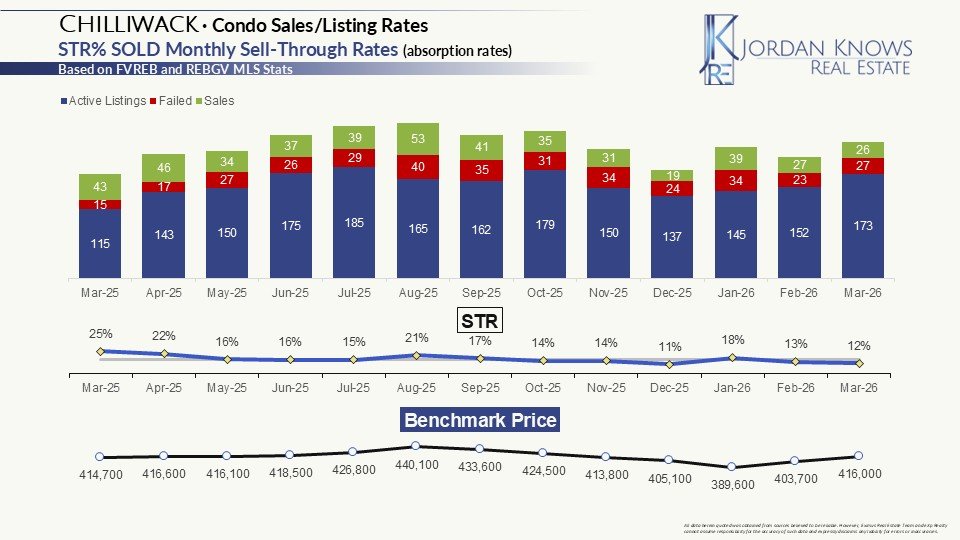
On the flip side, Chilliwack condos are sitting at a balanced 12%. This could make moving up challenging, as there are more people looking to buy townhomes and fewer buying condos.
Understanding these unique dynamics is crucial to making smart real estate decisions. Whether you’re buying, selling, or doing both, knowing the specific conditions of your property type and area can mean the difference between getting stuck or getting ahead. As always, you can dig deeper into these statistics on the market areas page and you’re always welcome to reach out to discuss further.
So as you can see, not all doom and gloom. While HPI is down year on year, average days to sell improved month over month. On the other hand, median days to sell in March were 12 for detached, and only 13 for attached, across the valley. This means that the same undercurrent of activity, quickly snatching up the best opportunities is still very much in play.
This really plays into how important it is to understand the market you’re operating in, and acting accordingly. If you’re shopping for a detached home, in an ok but not great location, that needs tlc, odds are you can negotiate hard and potentially get a great deal.
If you’re looking for sexy turn-key options in the best spots, act quick or lose your shot, and don’t expect a lowball offer to be well received. I also believe the sluggish March numbers are directly related to uncertainty surrounding the trade wars we’re in, and how that will play out long term. That being said, I believe there’s more going on under the surface.
So let’s talk about the elephant in the room…
Trump Tariffs
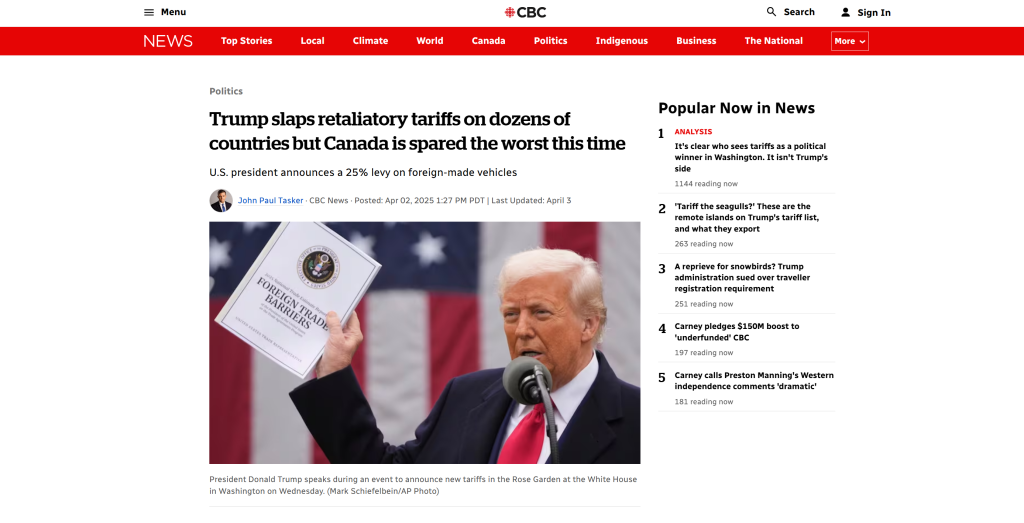
It turns out that US tariffs weren’t the existential threat they were being made out to be. Are they a pain? Absolutely. Are these sorts of measures new? Not even close. Previous U.S. administrations, including Obama’s, also imposed steel and aluminum tariffs. The USMCA still stands. According to Oxford Economics, the Canadian auto industry might take a 6% hit with around 2200 jobs lost. That’s not ideal, but it’s hardly catastrophic. Frankly, I’m more concerned about the Chinese tariffs.
China just hit Canadian agriculture hard, with 100% tariffs on canola oil and peas, and 25% on pork and seafood. That’s over $2.6 billion in exports under threat, and it’s a massive blow to Western Canadian farmers who were already gearing up for spring planting. The media and politicians have been largely mum on this.
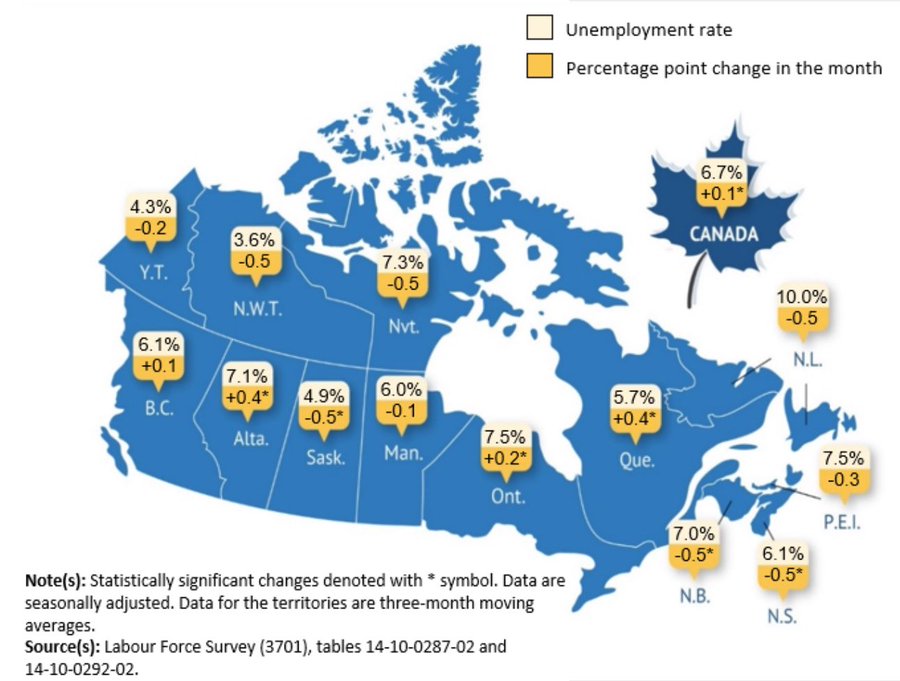
Meanwhile, Canada lost 33,000 jobs in March alone and saw unemployment rise to 6.7%. You could try blaming that on tariffs, but these issues started long before Trump. Youth unemployment has been between 12-14% for over a year.
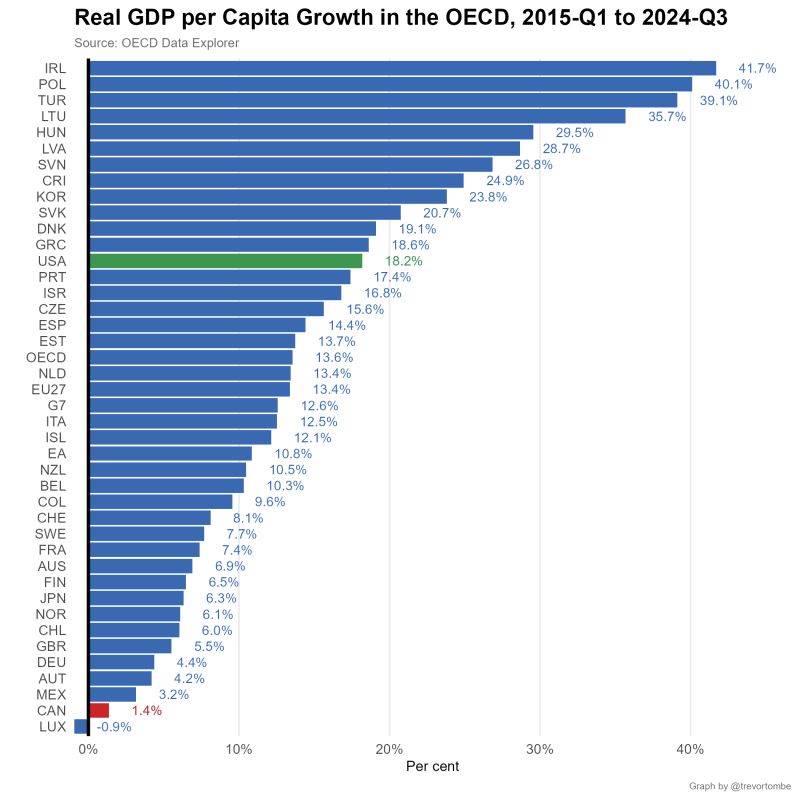
GDP Per Capita As Trevor Tombe, an economist at the University of Calgary, pointed out, Canada’s GDP per capita growth lagged behind the U.S. by a staggering 22-fold over the last decade. That’s not a trade issue, that’s a structural one. The reality is, while trade tensions make headlines, the deeper concern is our long-term economic competitiveness.
When uncertainty trickles down, it stalls consumer confidence and decision-making, especially in housing. The Fraser Valley’s sluggish March isn’t just about rates or inventory, it’s about the broader sentiment. People don’t move when they’re unsure of what’s coming next.
That’s my take, but I’d love to hear yours. How do you see this playing out? Do you think the tariffs will stick around long term? Will this lead to more asset inflation and wage stagnation, or are we heading for a different outcome entirely?
Drop a comment, send me a message, I’d love to hear your take. And if you have any questions about buying, selling, or investing in Fraser Valley real estate, let’s chat. I’m always happy to help.


